NYC Violation Tracker
An interactive map that turns three years of NYC idling-complaint data into a scrubbable, play-it-back timeline — so a story you'd normally read in a spreadsheet becomes something you can watch unfold.
- Year
- 2025
- Medium
- Civic Tech · Data Visualization
- Role
- Product Design · Data Viz · Frontend
New York's Citizens Air Complaint Program lets everyday residents report idling trucks and share in the fines. It works — but the resulting record is tens of thousands of rows of coordinates, timestamps and company names that almost nobody outside the agency ever actually sees.
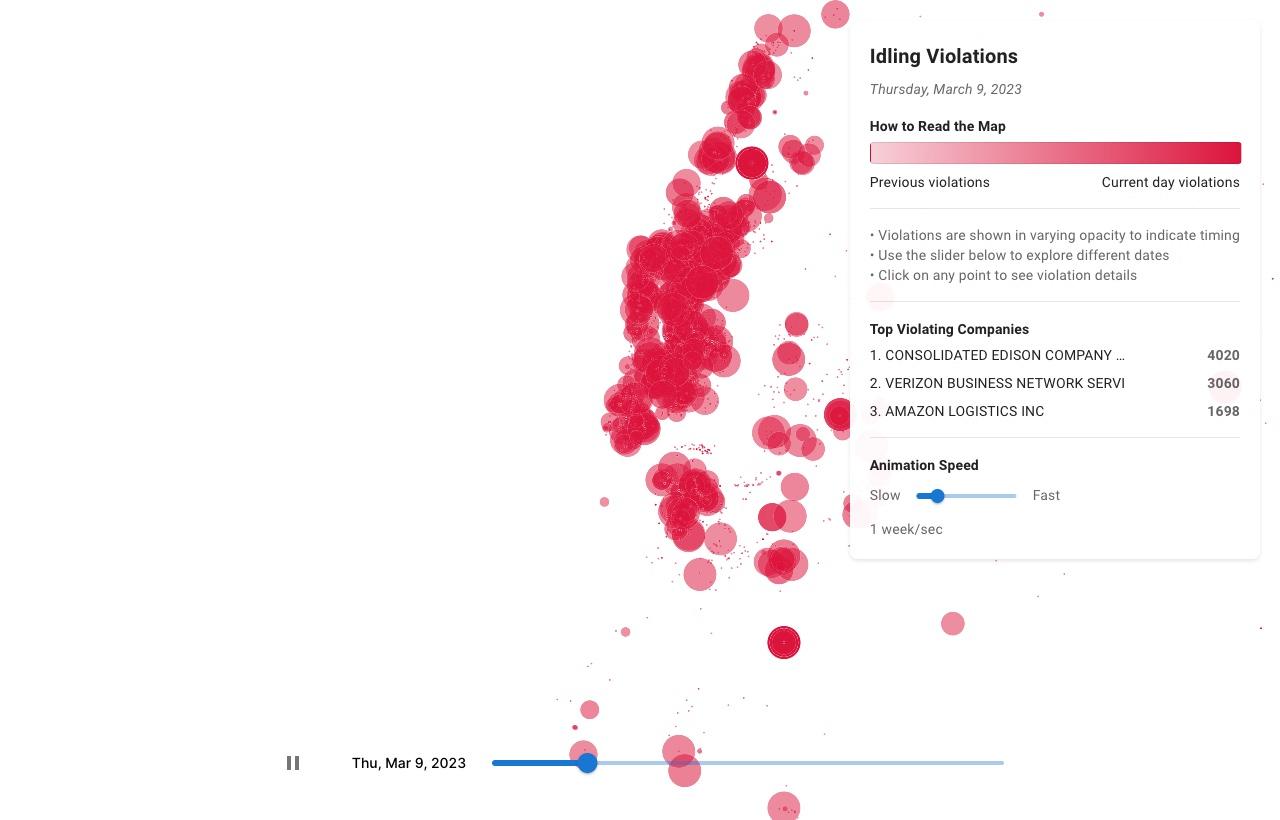
This prototype reframes that record as a single living map. Every complaint is a point, opacity encodes how recent it is, and a timeline lets you scrub or play back three years in seconds — watching the hot spots move block by block.
The brief
Take an open civic dataset that only reads as a table and make it legible — and a little visceral — in under thirty seconds, with no legend-studying required. The constraint: it had to run entirely in the browser, on the raw data, and stay smooth enough to animate on a laptop.
Three years at a glance
The interface is deliberately quiet. A short gradient legend does the explaining, a running leaderboard of the most-cited companies anchors the story in names people recognise, and the date scrubber doubles as both control and progress bar. Press play and the city fills in; the worst corridors announce themselves.
Under the hood
The complaint records are projected client-side and drawn to a single canvas layer, while a lightweight React UI handles the timeline, playback speed and leaderboard. Points are batched and their alpha is recomputed each frame against the current date, so 'recent versus historic' reads instantly — no separate legend lookup, no server round-trips.
The result is a piece you explore rather than parse — the kind of small, sharp tool that makes an accountability program feel real instead of bureaucratic.